Work
Industries and Clients:
Unfortunately, Non-Disclosure Agreements (NDAs) at my former employer preclude from me sharing directly my previous work and client list. What I can tell you is that they ranged from Fortune 500, publicly-traded corporations all the way down to mom-and-pop small businesses. In a little over 6 years, I had the pleasure and privilege of working with literally hundreds of different websites and brands.
Broad client industries included:
eCommerce:
- Fragrances
- Electronics
- Personalized gifts
- Clothing
- Event tickets
- Consumer Packaged Goods
Business to Consumer:
- Legal Services
- Financial Services
- Higher Education
- Real Estate
- HVAC
- Home Improvement
- Medical and Dental Services
- Insurance
Business to Business:
- Network security solutions
- Data management solutions
- Technology skills training
- Big Data/BI Platforms
- Payroll Software
- Billing Software
- Insurance
So, what employers will find in me is someone well versed in:
- Learning completely new industries in very short period of times.
- Getting into the mindset of potential customers and understanding buyer journeys.
- Melding uniform SEO “best practices” with industry-specific insights and strategies.
My SEO Philosophy:
Although I have experience in multiple traffic channels, particularly in regards to reporting and data analysis, organic search is the one I have the most direct experience in working with. After 6+years, I’ve developed a particular high-level philosophy and approach toward site audits and strategy development for organic search.
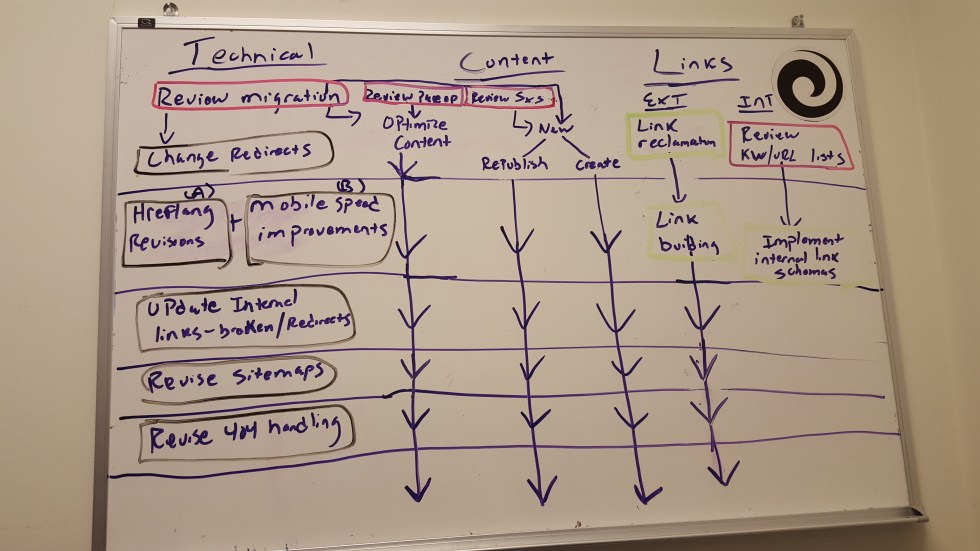
The picture below shows a hand-drawn visualization of my approach:

The whiteboard sketch above was borne out of ongoing conversations with colleagues about how to approach site audits and strategies in a way that allows for unique deliverables but repeatable and consistent processes and philosophies.
3 Pillars:
Roughly put, the 3 highest level “musts” for sound organic search visibility are:
- Indexation – Sites must be fully and properly crawled, rendered, cached and indexed by Google and other search engines.
- Relevancy – Sites must demonstrate sufficient Relevancy signals for search engine queries. Onpage body content and specific markup are key components of relevancy.
- Authority – Sites must demonstrate sufficient Authority/Trust signals. This involves the “flow” of external link equity into a site and within the site, as well as other indicators of expertise/trust, including co-citations, markup, link neighborhoods, etc.
Whatever inhibits or promotes a site’s organic search visibility, it can almost always be expressed as a function of one of these 3 core “pillars”, or put another way: onpage, offpage and within-page.
Although every site site comes with its own strength and weaknesses, those with sound organic search visibility typically are not critically weak in any one pillar. In my experience, sites with big enough imbalances between these pillars may not realize the same ROI on investments in other areas until these imbalances have been addressed. Sites with great content might have very slow load times due to uncompressed images or inefficient scripting. Or sites with amazing backlink profiles might have inconsistent content assets.
Sequencing and Resource Allocation:
When delivering finalized audits and strategies, I prefer to frame Action Items and next steps along all 3 pillars in 3 separate and parallel tracks of effort. Because the work of web developers rarely impacts that of a copywriter, nevermind a PR or outreach professional, the art and science of site auditing and strategy development involves sequencing the Action Items in the most efficient manner based on an acute and honest understating of both client and agency resources.
Additionally, I prefer to tie back all 3 pillars/tracks into broad time tables:
Short Term Goals: Critical red alarm issues, quick and discreet wins and low-hanging fruit that can be addressed within a 6 month period.
Mid-Term Goals: Longer term but terminable tasks and projects, including site migrations and re-launches, content creation cycles, linkable asset development, that can be typically be addressed within 6 to 12 months.
Long-Term Goals: Long term and perhaps ongoing marketing initiatives, from link building to PR to link disavowal to site maintenance and “cleanup” (redirects, 410s, etc).
It’s not the prettiest doodle, but you can see a little of this “tracking” methodology sketched out from a former strategy session below:
Data Visualizations:
I’m a self-professed data geek. My love for working with numbers dates all the way back to 6 years old and baseball card stats. Even in my mid-30’s I still crunch and play with sports stats for leisure and hobby.
For example, here’s an annotated scatterplot I made for the NY Mets:
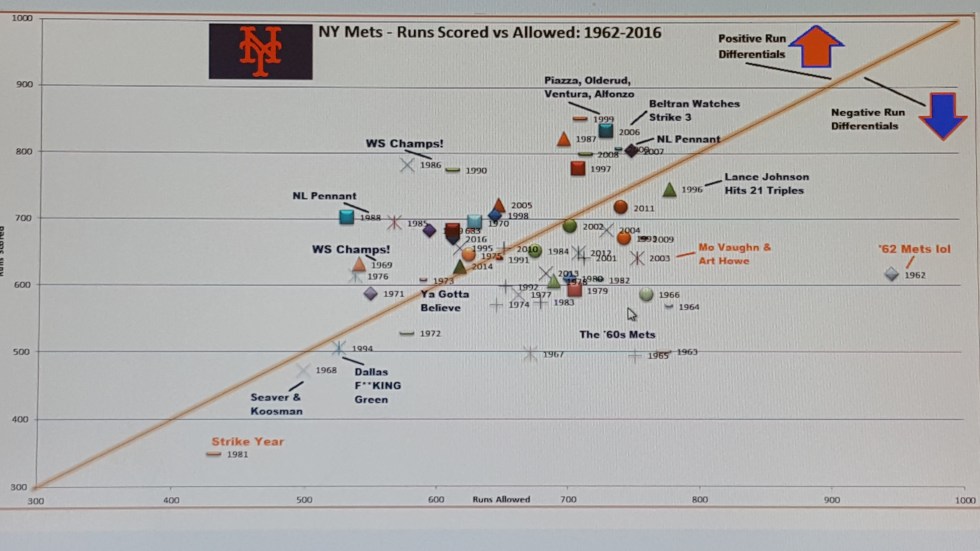
Scatterplots are a very specific data visualization, but I was partially inspired by a mimosa celebration breakfast. Some people see cups, but I see something entirely else:

Each dot on the scatterplot represents an entire season of baseball for the Mets, based on how many runs they scored and allowed that year. I scraped data from Baseball-Reference.com, dumped it into a table and generated the graph in Excel. I saved the image and used image editing software (Paint? Picasa?) to personally annotate some of the more memorable and infamous seasons throughout their history.
Dots above the orange line bisecting the graph represent generally “good” seasons (positive run differentials), and those below the line represent generally “bad” seasons (negative run differentials). At a quick glance, what kind of sadist am I for rooting for this team?
Back of Napkin Visuals:
Besides work and sports, what else do I like to graph and chart? ANYTHING! I believe the power and potential of data visualizations to tell stories is not limited to the business world or even particularly large data sets. A keen analyst should be able to tell meaningful stories and narratives with sometimes the simplest visuals or smallest data sets. If you can draw it on a napkin, you’ve always got a starting point.
So, for example, in the midst of Election Season 2016, I created a little Public Service Announcement for online debate:

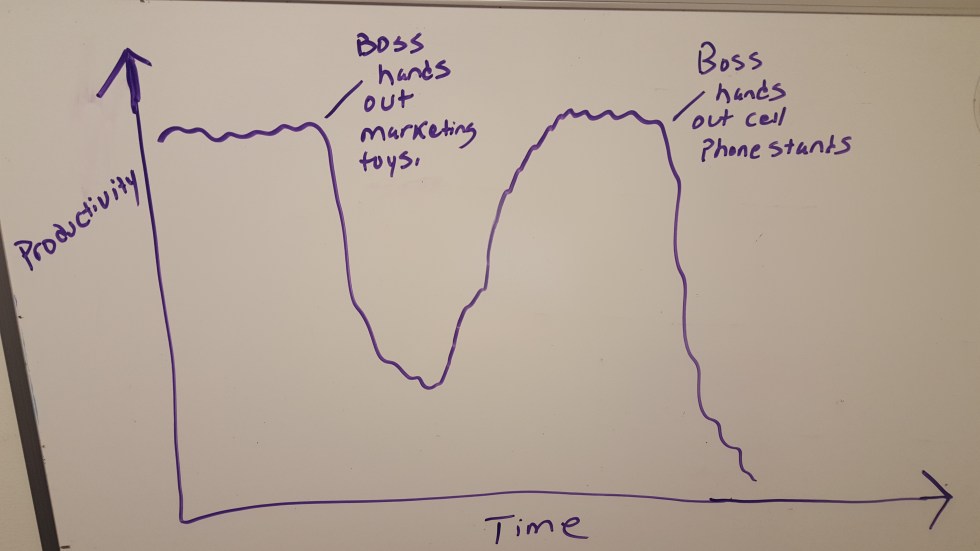
Or, the day my boss came back from the corporate “swag bag” printers, I closely monitored employee productivity for the day:
Or, for general counsel and workplace troubleshooting for colleagues, there’s this:

My wife is appreciative of my graphing passions but perhaps less so than I think:
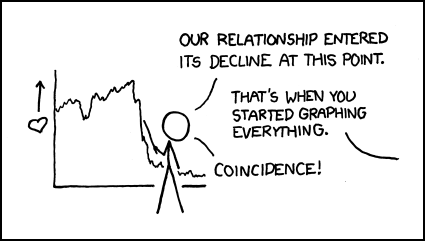
Comic Credit: xkcd.com
Coffee Spill Disclaimer:
By now, I hope you can better picture the experience, passions and, errrr, quirks I’d bring to an organization. I’d be remiss, however, if I didn’t share one last data viz, courtesy of some former co-workers:
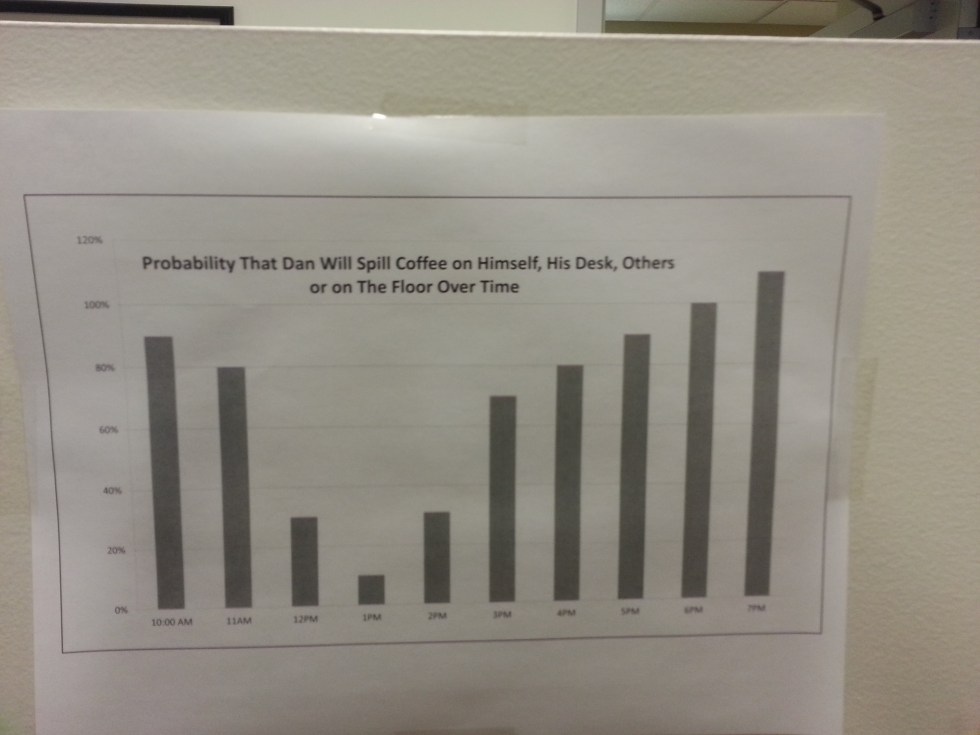
Although the graph type and formatting isn’t what I’d have chosen, I can attest to the general veracity and integrity of the data set. If periodic coffee spills are an absolute deal-breaker, it’s best we acknowledge that now.
If not, let’s speak! Use the Contact page or email me directly at metsfan1120@yahoo.com.
